
Statistics On Life Insurance At A Glance
No matter your walk of life in this country, it’s a good idea to cover your dependents and loved ones with a life insurance policy. But, many Americans (42%) hesitate to get life insurance because they believe it costs too much (even though consumers overestimate costs by 3-6 times the actual rates). [3]
Worse, they might avoid it altogether because of procrastination. Take a look at the key life insurance facts below to better understand how life insurance can serve as a powerful tool for financial security.
- Covering burial and final expenses is the #1 reason that Americans purchase life insurance, with 60% stating it’s important to them. [3]
- 60% of Americans say “paying for burial expenses” is one of the top five reasons they have life insurance. [10]
- 23% of Americans only consider life insurance for burial and final expense coverage. [3]
- Whole life insurance premiums vary with age, health, and policy size. Monthly costs for a high-value $100,000 policy range between $156 for a 35-year-old woman and $1,856 for an 85-year-old man.
- The average life insurance policy size for new contracts was $209,000 as of 2024. [1]
- 33% of men feel very knowledgeable about life insurance, compared with just 23% of women. [10]
- Roughly a quarter of men (20%) and women (27%) consider life insurance as a way to supplement retirement income. [3]
- 42% of women are concerned about having enough money for a comfortable retirement. [11]
- Almost one-third (30%) of Americans would suffer financial hardship within one month of the unexpected death of a wage earner. In comparison, nearly half (47%) only have a six-month runway.[10]
- 92% of consumers researched life insurance online in 2025, up from 71% in 2015. [10]
- 68% of people with dependents who are enrolled in life insurance feel financially safe, compared with 47% of people without a policy. [6]
How Many People Have Life Insurance?
Currently, 52% of Americans own a life insurance policy (about 172.5 million people). However, 40% of total adults (insured and uninsured) believe their coverage is insufficient. Additionally, over 100 million Americans are uninsured or underinsured. [10]
Several factors affect the decision to purchase life insurance coverage, including:
| Age | Higher-income consumers and higher-net-worth individuals may be more focused on asset protection and estate planning, making them more likely to buy life insurance. |
| Income level | Younger Americans are increasingly interested in insurance to protect their families, though older adults have the highest enrollment rates. |
| Employment | Many Americans have insurance through their employer. This number lowers as Americans get older and reach retirement age. |
| Gender | Women are more likely to worry about familial well-being but less likely to purchase life insurance than men. |
| Marital status | Married people are more likely to buy life insurance than single individuals, possibly due to the added responsibilities of marriage, like joint mortgages and finances, as well as children. |
Age
Age, however, is the biggest determinant of whether someone will purchase life insurance. As baby boomers continue to enter the 60+ age group, more will depend on their retirement savings and other sources of post-career income. Here are a few life insurance statistics by age.
- 55% of working adults have employer-sponsored life insurance. [10]
- Gen Z and Hispanic adults are the least likely to say they own life insurance. [10]
- More than one-third (36%) of uninsured Americans haven’t purchased insurance because they don’t know what type or how much they need. [3]
- 80% of Gen Z and Millennial consumers say they consult social media to learn about financial concepts and products. [10]
- Nearly 1 in 4 Gen Z adults (23%) cite never being approached by a life insurance agent as the reason they haven’t purchased coverage. [10]
- 39% of Americans plan to buy a life insurance policy within the next year, and millennial (50%) and Gen Z (44%) populations are the most interested. [9]
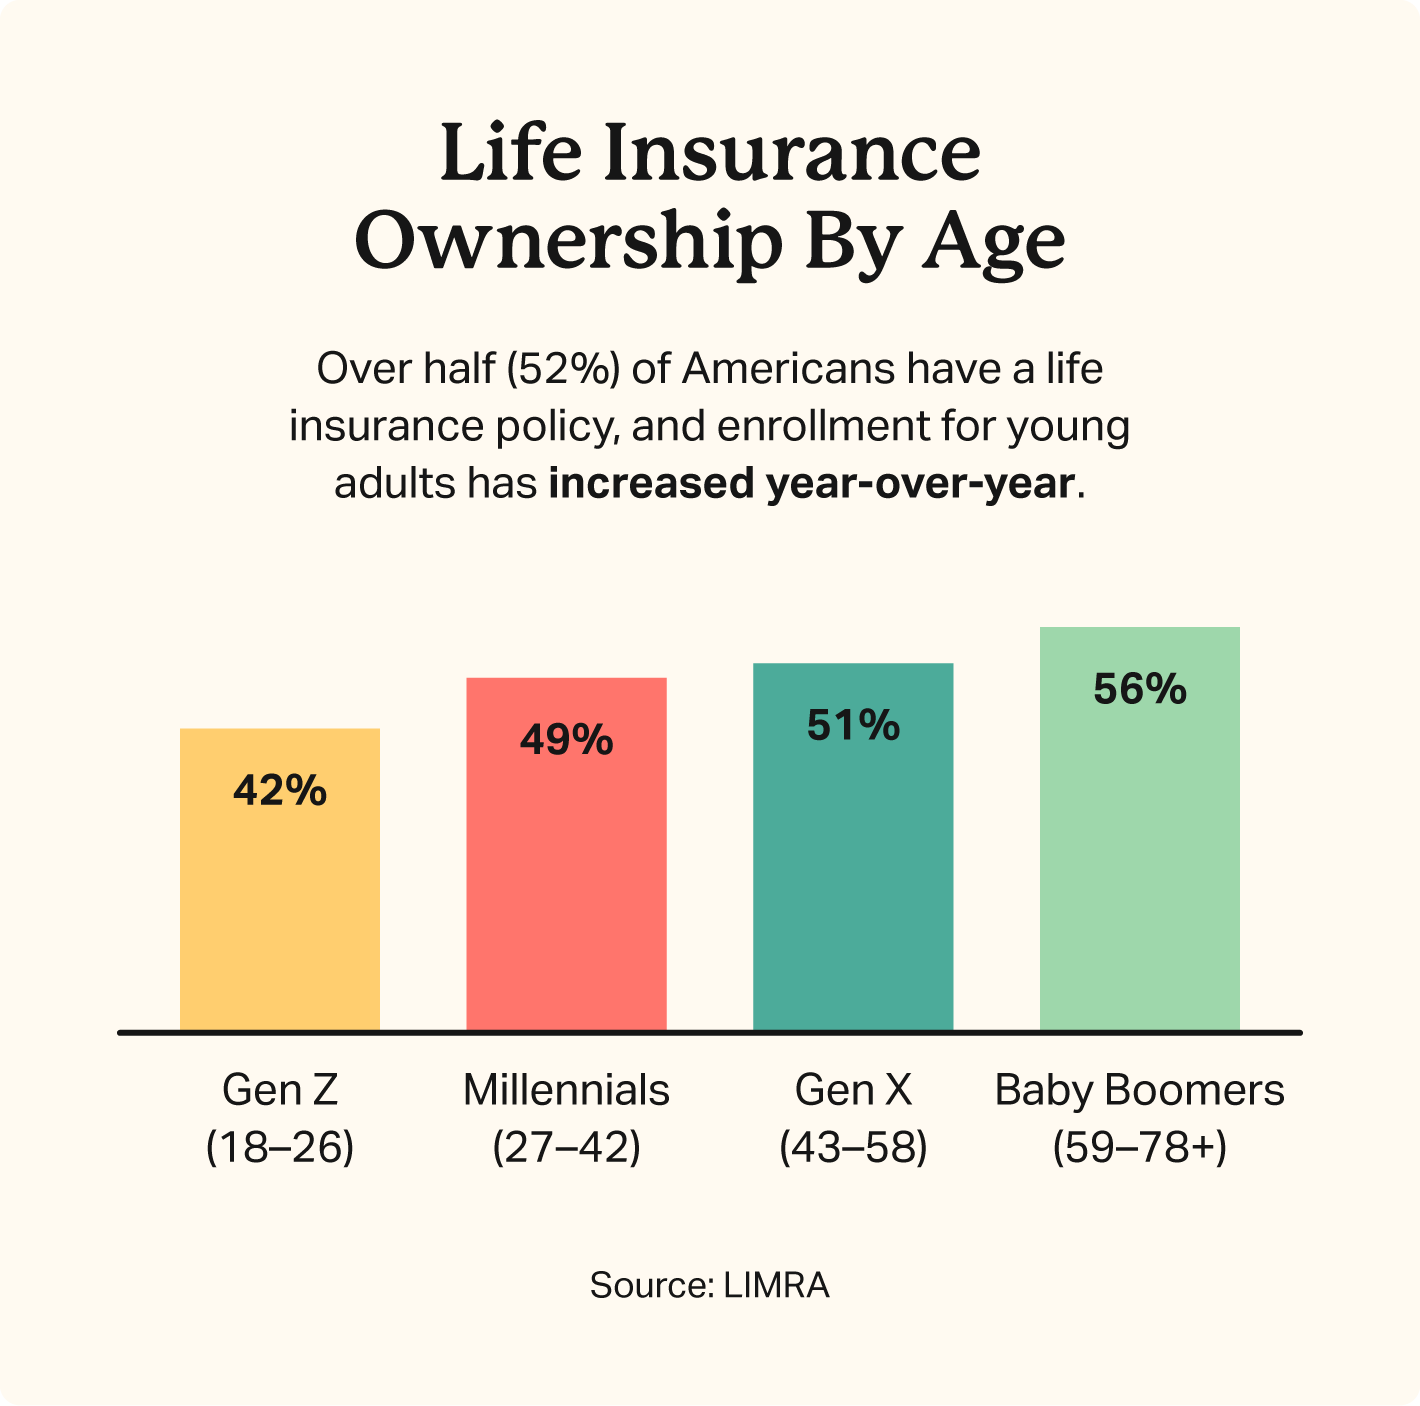
- 42% of young adults ages 18-26 have a life insurance policy. [10]
- Gen Z ages 18-26: 42%
- Millennials age 27-42: 49%
- Gen X ages 43-58: 51%
- Baby Boomers ages 59-78+: 56%
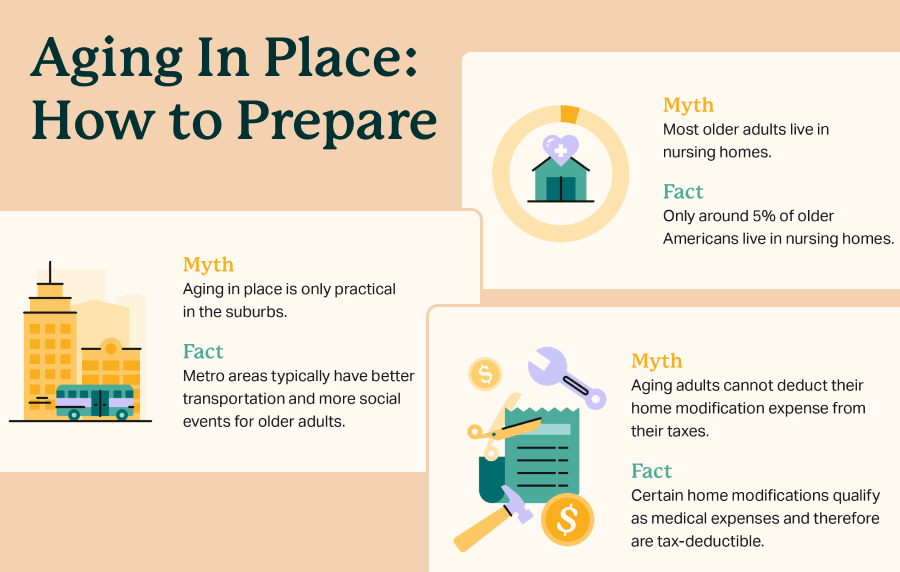
For more on how older adults are planning for long-term stability, see our guide on aging in place trends.
Lifestyle
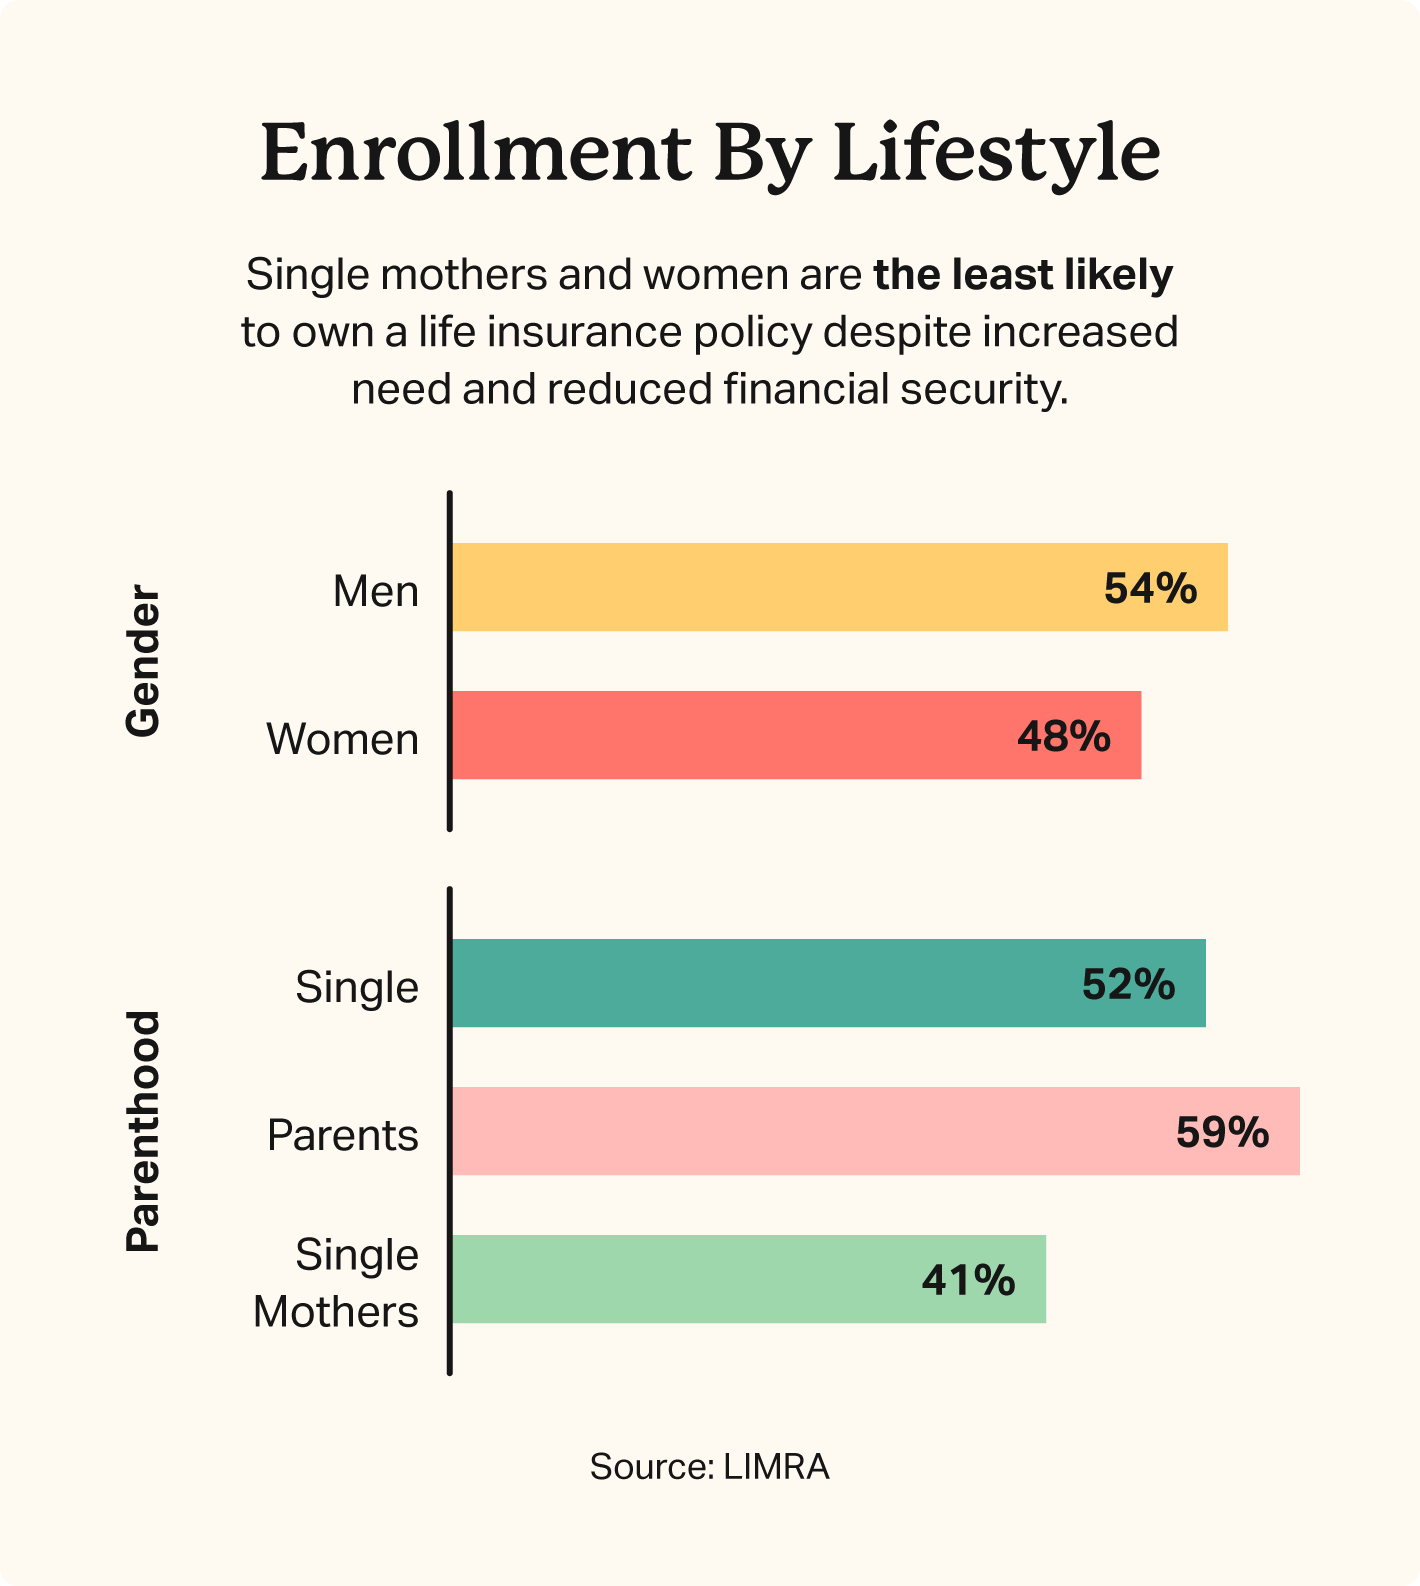
- Just 41% of single mothers have life insurance. However, 59% of single mothers believe they need more life insurance, in part to cover their increased financial needs as independent providers [9]
- Parents of minors are far more likely to have active life insurance policies (59%) compared to everyone else (52%). [3]
- Men are more likely to be insured than women in America, at 54% and 48%, respectively. [10]
- Nearly half of Americans still prefer working with a financial professional when purchasing life insurance. [10]
- More customers are shopping online, and nearly a quarter (25%) of adults would prefer to compare and purchase a new policy entirely online without an in-person appointment. [10]
- Social media is a growing resource for financial and life insurance insights, with 62% of Americans turning to it for such information, rising to 80% among Gen Z and Millennial consumers. [10]
Race and ethnicity
Race and ethnicity significantly influence life insurance ownership rates, with notable gaps across groups.
- Hispanic Americans have the lowest life insurance ownership rate of any ethnic group, with coverage dropping 11 percentage points from 51% in 2021 to just 40% today. [4]
- Black Americans have the highest life insurance ownership rate of any ethnic group at 58%. However, 49% say they need or need more coverage. [10]
- Asian Americans have a 57% ownership rate, while White Americans have a 52% ownership rate, both above the national average of 51%. [10]
US Life Insurance Industry Statistics
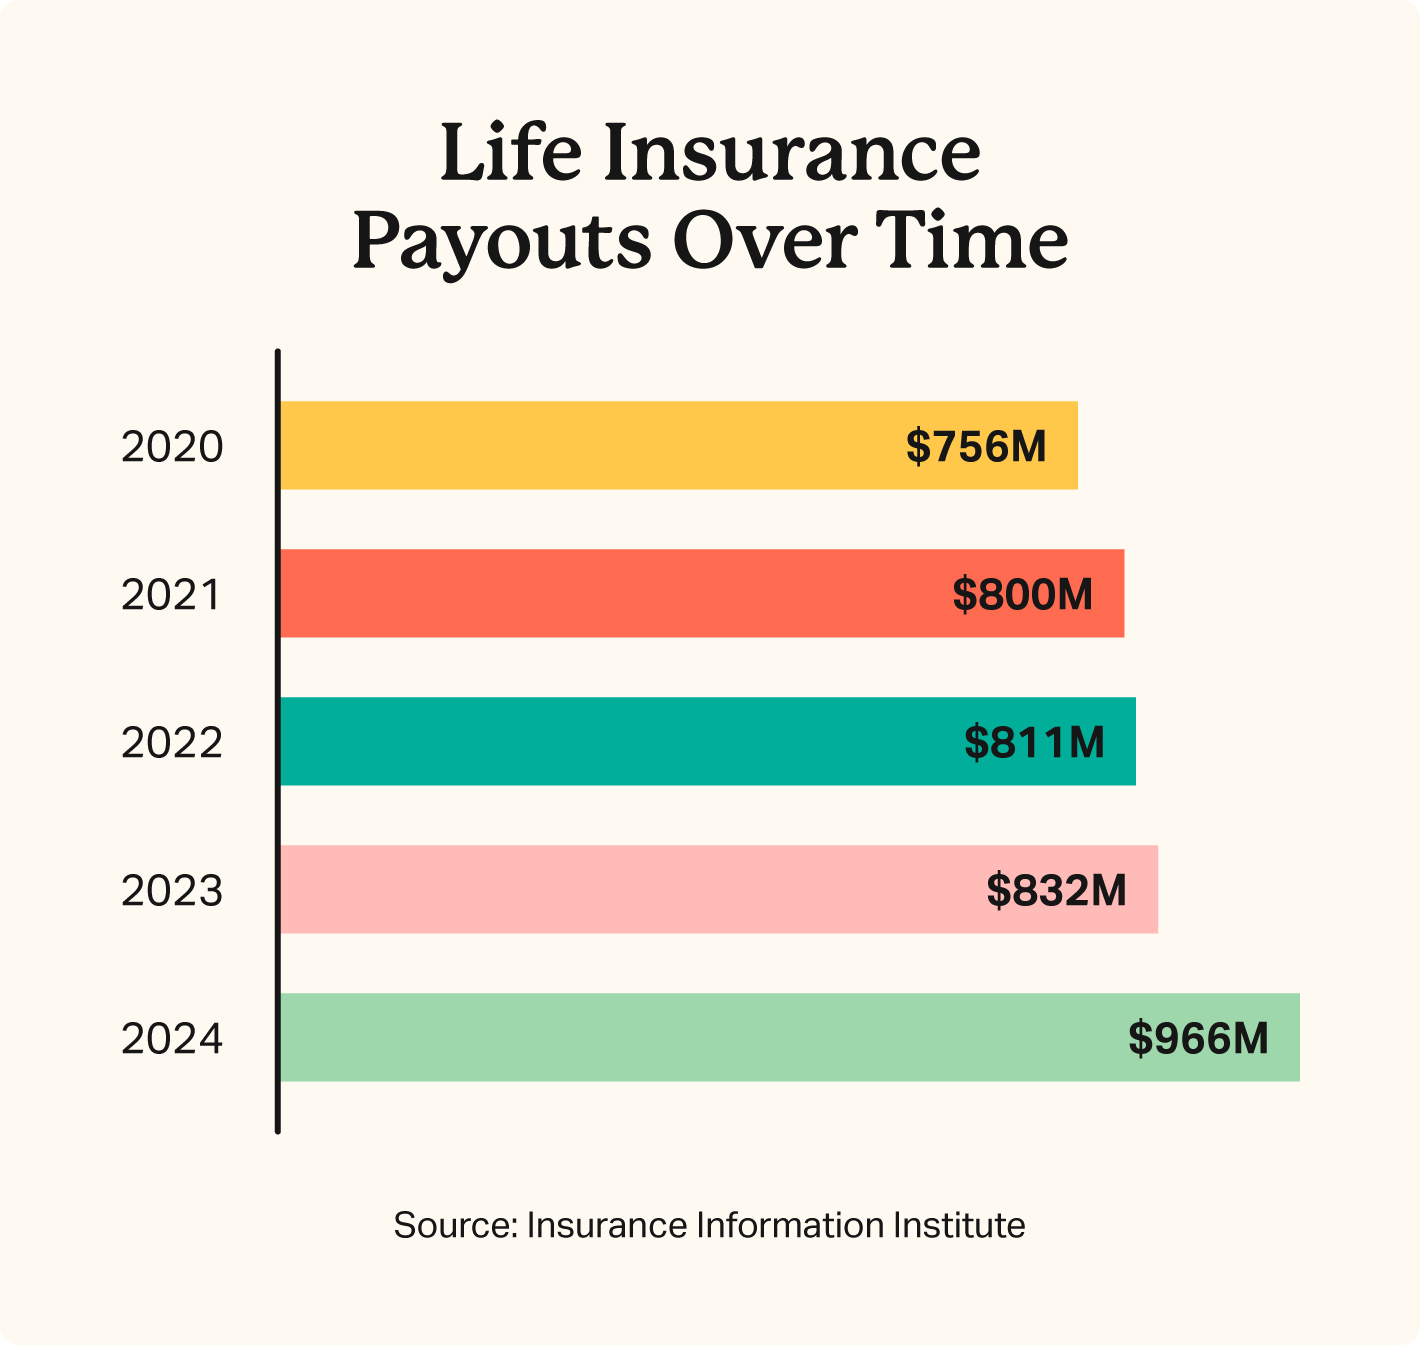
Life insurance is a sizable part of many Americans’ plans for their own future, and the industry is booming. Total benefits and claims paid out by U.S. life insurers grew to nearly $966 billion in 2024, up from $831.9 billion the previous year. [10]
Life expectancy is at its lowest level in decades, which means policyholders aren’t living as long either. Reduced life expectancy could lead insurance companies to see continued increases in payouts in the coming decades.
- Total L&H benefit payments grew 8% in 2024 to $374.5 billion, driven primarily by a sharp increase in A&H benefits, while total surrenders reached $484.2 billion, a 16% increase over 2023. [12]
- Only one-third of consumers know that insurance brokers need accreditation. [2]
- The 10 largest L&H companies collectively held 48.9% of the market in 2024, down from 49% in 2023. [12]
- MetLife remains the largest L&H insurer, writing $98.8 billion in direct premiums in 2024 for an 8.56% market share, followed by Equitable Holdings at $94.6 billion. [12]
- By year-end 2024, the L&H sector held approximately $9.3 trillion in total assets, including $3.3 trillion in separate accounts. [12]
- Total L&H sector expenses rose 15% in 2024 to $1.09 trillion, up from $951 billion in 2023. [12]
- In 2024, insurers completed 16 public equity offerings totaling $3.9 billion, up from 14 worth $3.2 billion in 2023. [12]
- L&H net investment income reached $247.7 billion in 2024, up 10% from the prior year and the highest level recorded in the past five years. [12]
Common Life Insurance Misunderstandings
Life insurance helps supplement retirement income, replace the income of a high earner, and provide stability after a loved one passes away. Still, many Americans don’t have it. Let’s break down a few common myths that deter people from getting the life insurance coverage they need.
1. The IRS will take taxes out of my life insurance benefit payout.
Even though 1 in 3 Americans believe this myth, death benefits from life insurance are not taxable. However, you will have to report and pay taxes on any related interest you receive.
That said, there are a few exceptions. If the payout earns interest, that interest is taxable. In some cases, estate taxes may also apply to high-value estates, and certain policy withdrawals or loans can have tax implications depending on how they’re structured.
2. Insurance is just too expensive for most family budgets.
More than half of Americans (52%) cite life insurance as too expensive, even though 72% overestimate the true cost of a basic term life insurance policy. [7]
3. Life insurance policies cost more than $1,000 annually.
This isn’t quite accurate, even though 43% of millennials think so. In reality, a policy for a healthy 30-year-old could cost around $170 annually. [5]
4. Technology advancements will lead fewer people to rely on insurance.
Interest in incentivized activity tracking for wellness programs has grown from 33% in 2016 to 40% in 2024, showing consumers are increasingly willing to embrace technology as part of their insurance experience. [6]
5. Most insurance customers are technology-averse.
92% of consumers researched life insurance online in 2025, up from 71% in 2015, and 51% say they would use AI tools to research life insurance options. [10]
6. Customers are more focused on privacy than premiums.
40% of consumers are interested in sharing personal activity data with their insurer in exchange for wellness program incentives, rising to 50% among Millennials. [6]
7. Almost half of all insurance claims aren’t paid out.
Life insurers have historically paid nearly all claims filed. In 2024 alone, they paid $89 billion to life insurance beneficiaries across the United States. [8]
Build A Stronger Financial Future For Your Family
Life insurance is one of the simplest ways to help protect your family’s financial future. The right coverage helps with immediate expenses like funeral costs while also supporting everyday needs such as housing, bills, and other ongoing responsibilities.
Planning ahead can also make a difference. Getting coverage earlier or opting for set-term insurance often means lower costs and more options, giving you the flexibility to choose a policy that fits your needs over time while also providing peace of mind that your family can maintain their lifestyle and move forward without added financial stress.
- Nationally licensed life insurance agent with over 16 years of experience.
- Personal annual production that puts him in the top .001% out of all life insurance agents in the nation.
Anthony Martin is a nationally licensed insurance expert with over 16 years of experience and has personally served over 10,000 clients with their life insurance needs. He frequently authors entrepreneurial and life insurance content for Forbes, Inc.com, Newsweek, Kiplinger, and Entreprenuer.com. Anthony has been consulted as an expert life insurance source for dozens of high-profile websites such as Forbes, Bankrate, Reuters, Fox Business, CNBC, Investopedia, Insurance.com, Yahoo Finance, and many more.
- Nationally licensed life insurance agent with over 20 years of experience
- Best selling Amazon author.
Jeff Root is a nationally licensed life insurance expert with over 20 years of experience. He has personally helped over 3000 clients with their life insurance needs. Jeff is a best-selling Amazon author and the managing partner of a highly successful insurance brokerage that manages over 2,500 licensed insurance agents across the USA. He has been a featured life insurance source for prestigious websites such as Forbes, Bloomberg, MarketWatch, Nerdwallet, and many more.
- Nationally licensed life insurance agent with over 15 years of experience
- Best selling Amazon author of five insurance sales books.
David Duford is a nationally licensed insurance expert with over 15 years of experience. He has personally helped more than 1,500 clients buy life insurance. David has been featured as an expert source for highly authoritative publications such as A.M. Best and Insurancenewsnet. He also runs one of the largest YouTube channels to help aspiring insurance agents serve their clients better.
Choice Mutual often cites third-party websites to provide context and verification for specific claims made in our work. We only link to authoritative websites that provide accurate information. You can learn more about our editorial standards, which guide our mission of delivering factual and impartial content.
-
Life expectancy. https://www.hsph.harvard.edu/news/hsph-in-the-news/whats-behind-shocking-u-s-life-expectancy-decline-and-what-to-do-about-it/
-
3. https://www.limra.com/siteassets/newsroom/liam/2023/0859-2023-liam-fact-sheet-2023_final.pdf
-
3. https://www.limra.com/siteassets/newsroom/liam/2023/0859-2023-liam-fact-sheet-2023_final.pdf
-
10. https://www.limra.com/siteassets/newsroom/liam/2025/2025_facts_about_life_insurance.pdf
-
3. https://www.limra.com/siteassets/newsroom/liam/2023/0859-2023-liam-fact-sheet-2023_final.pdf
-
1. https://www.acli.com/-/media/public/pdf/news-and-analysis/publications-and-research/2025fb/7_life_insurance_acli_fact_book_2025.pdf
-
10. https://www.limra.com/siteassets/newsroom/liam/2025/2025_facts_about_life_insurance.pdf
-
3. https://www.limra.com/siteassets/newsroom/liam/2023/0859-2023-liam-fact-sheet-2023_final.pdf
-
11. https://www.limra.com/siteassets/newsroom/liam/2025/Women_Life_Insurance_2025.pdf
-
10. https://www.limra.com/siteassets/newsroom/liam/2025/2025_facts_about_life_insurance.pdf
-
10. https://www.limra.com/siteassets/newsroom/liam/2025/2025_facts_about_life_insurance.pdf
-
6. https://lifehappens.org/blog/research_years/2022/
-
10. https://www.limra.com/siteassets/newsroom/liam/2025/2025_facts_about_life_insurance.pdf
-
10. https://www.limra.com/siteassets/newsroom/liam/2025/2025_facts_about_life_insurance.pdf
-
10. https://www.limra.com/siteassets/newsroom/liam/2025/2025_facts_about_life_insurance.pdf
-
3. https://www.limra.com/siteassets/newsroom/liam/2023/0859-2023-liam-fact-sheet-2023_final.pdf
-
10. https://www.limra.com/siteassets/newsroom/liam/2025/2025_facts_about_life_insurance.pdf
-
10. https://www.limra.com/siteassets/newsroom/liam/2025/2025_facts_about_life_insurance.pdf
-
9. https://www.limra.com/en/newsroom/news-releases/2023/new-study-shows-interest-in-life-insurance-at-all-time-high-in-2023/
-
10. https://www.limra.com/siteassets/newsroom/liam/2025/2025_facts_about_life_insurance.pdf
-
9. https://www.limra.com/en/newsroom/news-releases/2023/new-study-shows-interest-in-life-insurance-at-all-time-high-in-2023/
-
3. https://www.limra.com/siteassets/newsroom/liam/2023/0859-2023-liam-fact-sheet-2023_final.pdf
-
10. https://www.limra.com/siteassets/newsroom/liam/2025/2025_facts_about_life_insurance.pdf
-
10. https://www.limra.com/siteassets/newsroom/liam/2025/2025_facts_about_life_insurance.pdf
-
10. https://www.limra.com/siteassets/newsroom/liam/2025/2025_facts_about_life_insurance.pdf
-
10. https://www.limra.com/siteassets/newsroom/liam/2025/2025_facts_about_life_insurance.pdf
-
4. https://www.limra.com/en/newsroom/industry-trends/2025/hispanic-americans-and-life-insurance-bring-family-to-the-conversation/
-
10. https://www.limra.com/siteassets/newsroom/liam/2025/2025_facts_about_life_insurance.pdf
-
10. https://www.limra.com/siteassets/newsroom/liam/2025/2025_facts_about_life_insurance.pdf
-
10. https://www.limra.com/siteassets/newsroom/liam/2025/2025_facts_about_life_insurance.pdf
-
12. https://home.treasury.gov/system/files/311/Final%20FIO%202025%20Annual%20Report.pdf
-
2. https://home.treasury.gov/system/files/311/FIO%20Annual%20Report%202023%209292023.pdf
-
12. https://home.treasury.gov/system/files/311/Final%20FIO%202025%20Annual%20Report.pdf
-
12. https://home.treasury.gov/system/files/311/Final%20FIO%202025%20Annual%20Report.pdf
-
12. https://home.treasury.gov/system/files/311/Final%20FIO%202025%20Annual%20Report.pdf
-
12. https://home.treasury.gov/system/files/311/Final%20FIO%202025%20Annual%20Report.pdf
-
12. https://home.treasury.gov/system/files/311/Final%20FIO%202025%20Annual%20Report.pdf
-
12. https://home.treasury.gov/system/files/311/Final%20FIO%202025%20Annual%20Report.pdf
-
7. https://www.limra.com/siteassets/research/research-abstracts-shared/2024/securing-the-future/2024-insurance-barometer---securing-the-future-infographic.pdf
-
5. https://www.limra.com/siteassets/newsroom/help-protect-our-families/2022/sept/hpof-misconceptions-flyer-redesign_infographic_final.pdf
-
6. https://www.limra.com/siteassets/newsroom/help-protect-our-families/2022/march/feature/understanding-the-women_fact-sheet.pdf
-
10. https://www.limra.com/siteassets/newsroom/liam/2025/2025_facts_about_life_insurance.pdf
-
6. https://www.limra.com/siteassets/newsroom/help-protect-our-families/2022/march/feature/understanding-the-women_fact-sheet.pdf
-
8. https://www.acli.com/-/media/public/pdf/news-and-analysis/publications-and-research/2025fb/all_acli_fact_book_2025.pdf